


Illumination Design Using Ansys Zemax OpticStudio
著者: Eduardo Gonzalez,Sanjay Gangadhara
Design and Evaluation of a Telecentric Backlight
Telecentric backlight illuminators are ideal for machine vision applications that require high-contrast silhouettes, such as precise measurements of small details like the threads on a screw. Collimated, highly-concentrated light emits from the telecentric illuminator, minimizing diffuse reflections at the edge of the part under inspection. Standard backlights often produce unwanted diffuse reflections that reduce edge contrast, as shown in Figures 1 and 2. Additional benefits of telecentric backlight illumination include reduced camera exposure times because of increased light intensity, faster systems, and larger possible distance between the object and illumination source.
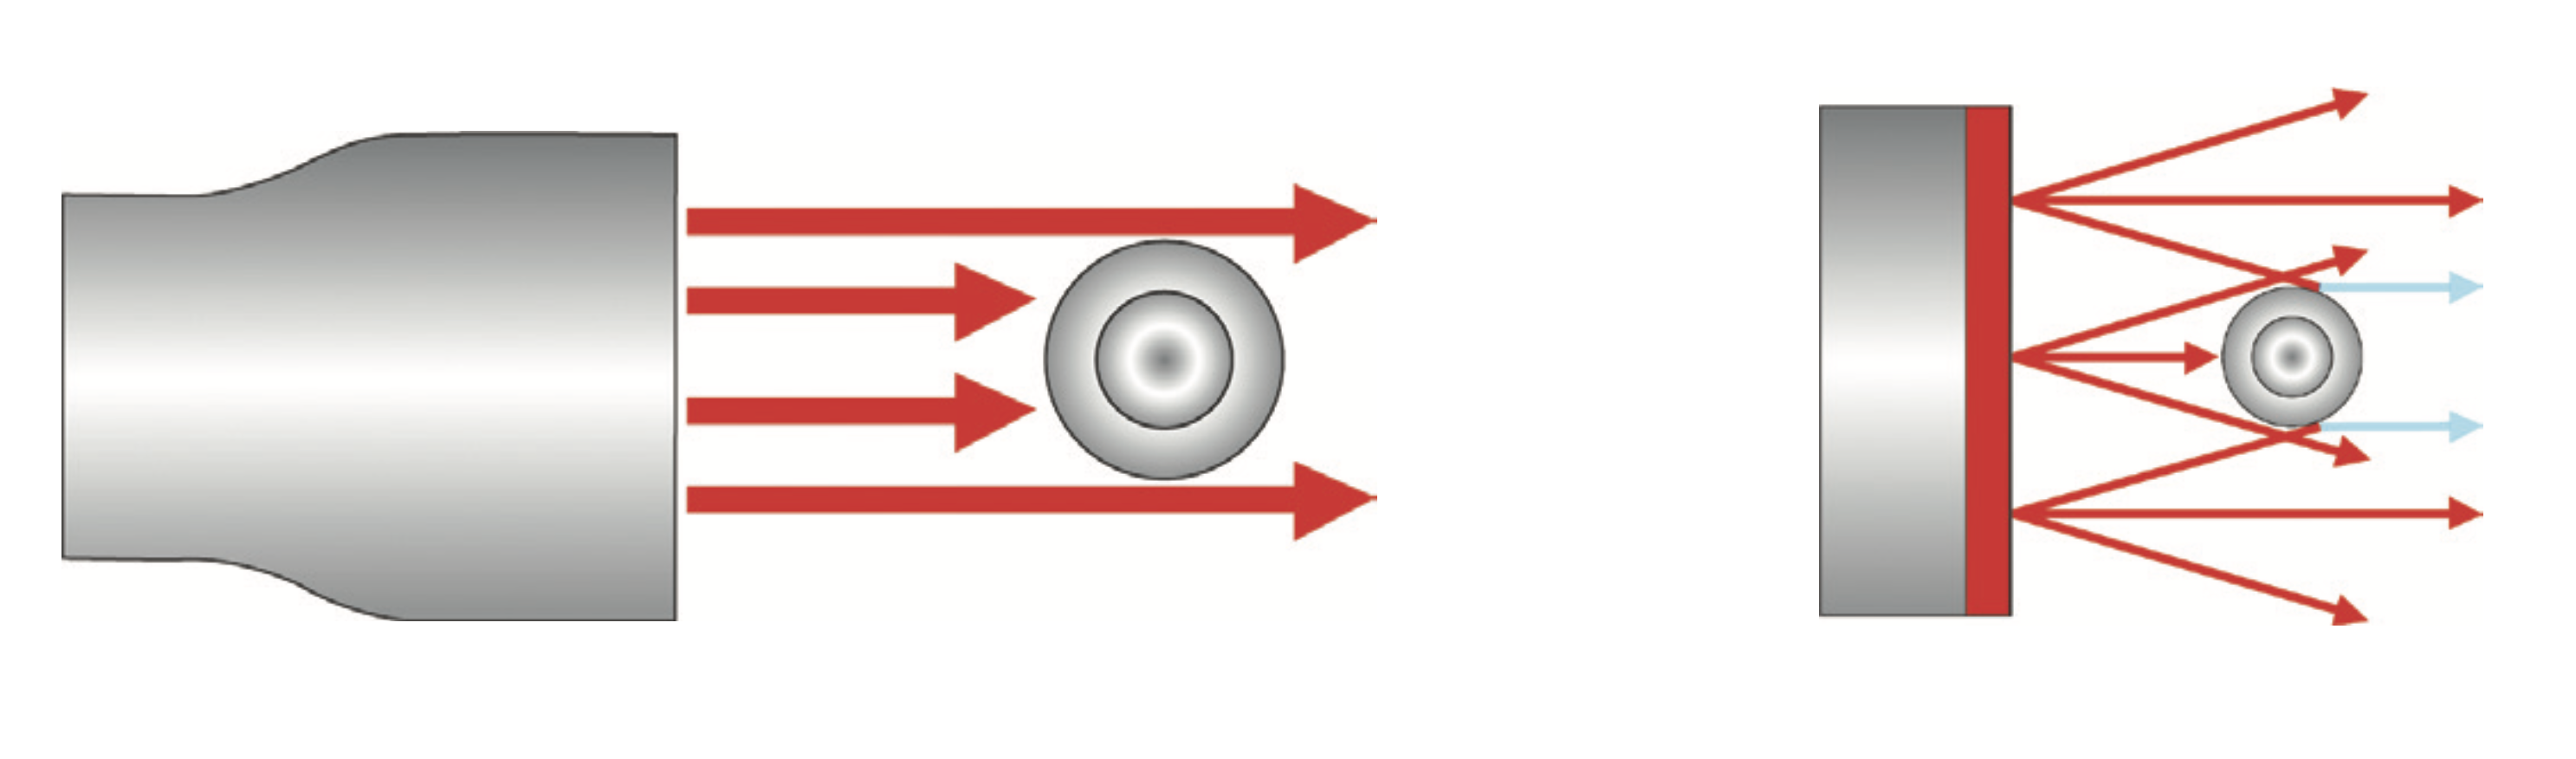
Figure 1: Collimated light rays from a telecentric illuminator (left) vs. diffuse reflections from a standard backlight (right)

Figure 2: Figure 2: Silhouette from a telecentric illuminator (left) vs. a standard backlight (right)
However, if a telecentric backlight is used with a telecentric imaging lens and they are not properly paired, the irradiance may not be uniform. In this instance, there was a decrease from peak irradiance of up to 18% across the sensor. Edmund Optics® utilized Ansys Zemax OpticStudio® to combat this uniformity issue for a specific illuminator and lens pairing and designed a telecentric backlight that matched a specific telecentric imaging lens to produce a more uniform image. By using sequential and non-sequential tools to design the telecentric illuminator in tandem with an imaging lens, a design in which the irradiance decreases by no more than 10% at any point on the sensor was achieved. Walking through this design process reveals several lessons that can be applied to other optical designs.
The Problem
The large aperture telecentric illuminator performed very well when analyzed by itself. The initial illuminator provided uniform illumination at the object, which was the intention of the design. When paired with Edmund Optics®’ 0.093X Telecentric Lens (part number 34018), there was a mismatch of the etendue, or angular and spatial distribution of light, from the illuminator with that of the telecentric lens. The mismatch manifested itself in the image plane as the non-uniformity seen in Figure 3.

Figure 3: Test result for the original design, showing a dark ring-shaped region of non-uniform irradiance
The telecentric illuminator and imaging lens should be modeled simultaneously to resolve this issue. This would allow for an analysis of the etendue of both subsystems to ensure there are no uniformity issues at the image plane. Checking a newly-designed telecentric illuminator in this way will result in an even irradiance distribution.
The Process
First, a value had to be assigned to the pass/fail metric. It was decided that the irradiance value anywhere on the sensor could not decrease from the peak value by more than 10%. The design was set up in the sequential mode of OpticStudio, and then incremental steps were used to get the design to a place where it could be analyzed in non-sequential mode. The design was optimized using RMS spot size as the figure of merit. In order to keep the manufacturability of the design within reason, physical properties of the lenses were controlled during optimization. The usual suspects of aspect ratio and edge thickness were controlled. When an optimization was finished, the design was converted from a sequential to a non-sequential (NSC) model in order to evaluate the radiometric performance. The metric being evaluated was uniformity across the sensor. If the uniformity was not to specification, then the design was further refined in sequential mode. It is important to note that, while the illuminator elements were varied, the telecentric lens with which it was paired was static. The design was considered complete when it met the chosen metric for uniformity across the sensor.
Accurate analysis of the design in the non-sequential mode of OpticStudio requires defining the correct source distribution, surface coatings on all optical components, and sensor type. As the source model determines the wavelength and energy distribution of the light entering the system, choosing the wrong model will provide incorrect information about the rays that land on the sensor for evaluation. Applying realistic surface coatings to both the front and back of all elements being modeled is important to ensure that less energy is lost when a ray splits due to Fresnel reflections at each of the surfaces. This is helpful for data gathering, but more importantly, ensures that the model is accurate when it comes to reflecting “as built” performance. There are several options for the type of sensor that can be used, with the “Detector Color” or “Detector Rectangle” versions being the most useful for our analysis. These two methods allow the user to determine the number of pixels on the sensor. “Detector Color” accurately displays the color of the light on the sensor, while the “Detector Rectangle” sensor does not have this capability. “Detector Rectangle”, however, has the ability to display both coherent and incoherent data, while “Detector Color” can only display incoherent data. The incoherent data was sufficient for our evaluation purposes.
After setting the system up for analysis, a ray trace was conducted (Figure 4). In our simulation, we let the rays split, and saved the results to a ray database (ZRD) file in order to make analysis faster for this particular run. Please note that these files are relatively large, so the compressed version of the complete data is often a good compromise between data density and used storage space. When the ray trace finishes, you can observe the irradiance at the detector plane. The ray trace allows the use of the detector viewer, which will permit different views of the irradiance. A false color view of the irradiance is shown in Figure 5. A linear scale was chosen for the analysis, but log scales are also available. As Figure 5 shows, the issue with the annular drop in irradiance was corrected. This design was chosen for manufacturing.

Figure 4: Ray trace control window

Figure 5: OpticStudio non-sequential simulation of new design
The Result
After the manufacturing tolerances were checked via a Monte Carlo analysis, the newly-designed lens was assembled. Figure 6 shows that the assembled lens performance matches the simulated image modeled in OpticStudio’s non-sequential mode. Combining the ability to complete the lens design in sequential mode and evaluate the real-world performance in non-sequential mode provided the necessary tools to improve the design of the illuminator. Not every illuminator needs to be designed in tandem with an imaging lens but, in this case, it made the manufactured product perform significantly better; the variation of irradiance across the sensor (relative to the peak value) was reduced from 18% to ≤10%. The type of illumination being used for the design is also important. This design revealed best practices for correctly modeling sources, coatings, and sensor type in OpticStudio’s non-sequential mode that will be beneficial in future designs.

Figure 6: Real-world test result for the new design, showing a more even irradiance profile than the original design
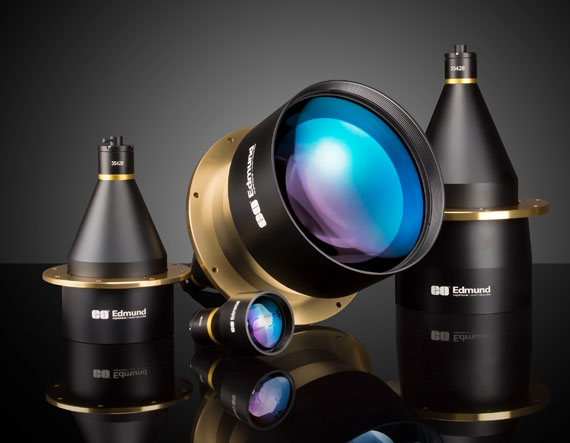
Off-the-Shelf Telecentric Backlight Illuminators
- Optically Collimated Light for Increased Edge Contrast
- Superior Collimation Ideal for use with Telecentric Lenses
- Easily Compatible with 8mm Coaxial LEDs or ¼” (0.312”) Fiber Light Guides
Design Services & Engineering Support
- Over 30 Years of Experience Designing Optical Components and Assemblies
- Analysis Expertise Spans Zemax, Code V®, FRED™, Solidworks, Matlab®, and More
- Designs Optimized for Integration and High Production Yields

もしくは 現地オフィス一覧をご覧ください
クイック見積りツール
商品コードを入力して開始しましょう
Copyright 2023, エドモンド・オプティクス・ジャパン株式会社
[東京オフィス] 〒113-0021 東京都文京区本駒込2-29-24 パシフィックスクエア千石 4F
[秋田工場] 〒012-0801 秋田県湯沢市岩崎字壇ノ上3番地